Stock analysis platform
A stock analysis tool
built for depth
As a comprehensive stock analysis app, Moula brings price history, technical indicators, financials, and valuation multiples into one tool, helping you take more informed stock picking decisions.
Free to start. No credit card required.
The stock analysis software that replaces your spreadsheets
Spreadsheets and finance sites each solve part of the problem. As an all-in-one stock analysis platform, Moula connects charts, financials, valuation, and portfolio tracking in a single tool.
| Spreadsheets / Google / Yahoo | ||
|---|---|---|
| Charts & technical indicators | × Near-real-time basic line charts or unstable imports. Indicators require add-ons or separate tools. Charts disconnected from your portfolio. | Candlestick charts with end-of-day OHLC and volume. MAs and Bollinger Bands built in. Timeframes switch instantly, tied to your watchlist. |
| Financial statements | × Limited charts and history. Data lives in separate pages or requires manual structuring. Hard to compare cleanly. | Up to 10 years history for financials sourced from SEC EDGAR. Annual or quarterly. One click from any stock. |
| Valuation over time | × Snapshot multiples or complex formulas. Historical tracking requires maintenance. | P/S and market cap over time. See expansion and compression across cycles. |
| Price & signal alerts | × Manual checks or third-party alert services. No native link to your watchlist or indicators. | Set alerts on price, P/S, P/E, RSI, MACD, or technical bias. Daily email when conditions are met. |
| Workflow & watchlist | × Multiple tabs, bookmarks, and tools. Research and tracking are separate. | Watchlist, charts, financials, and transactions in one workspace. One source of truth. |
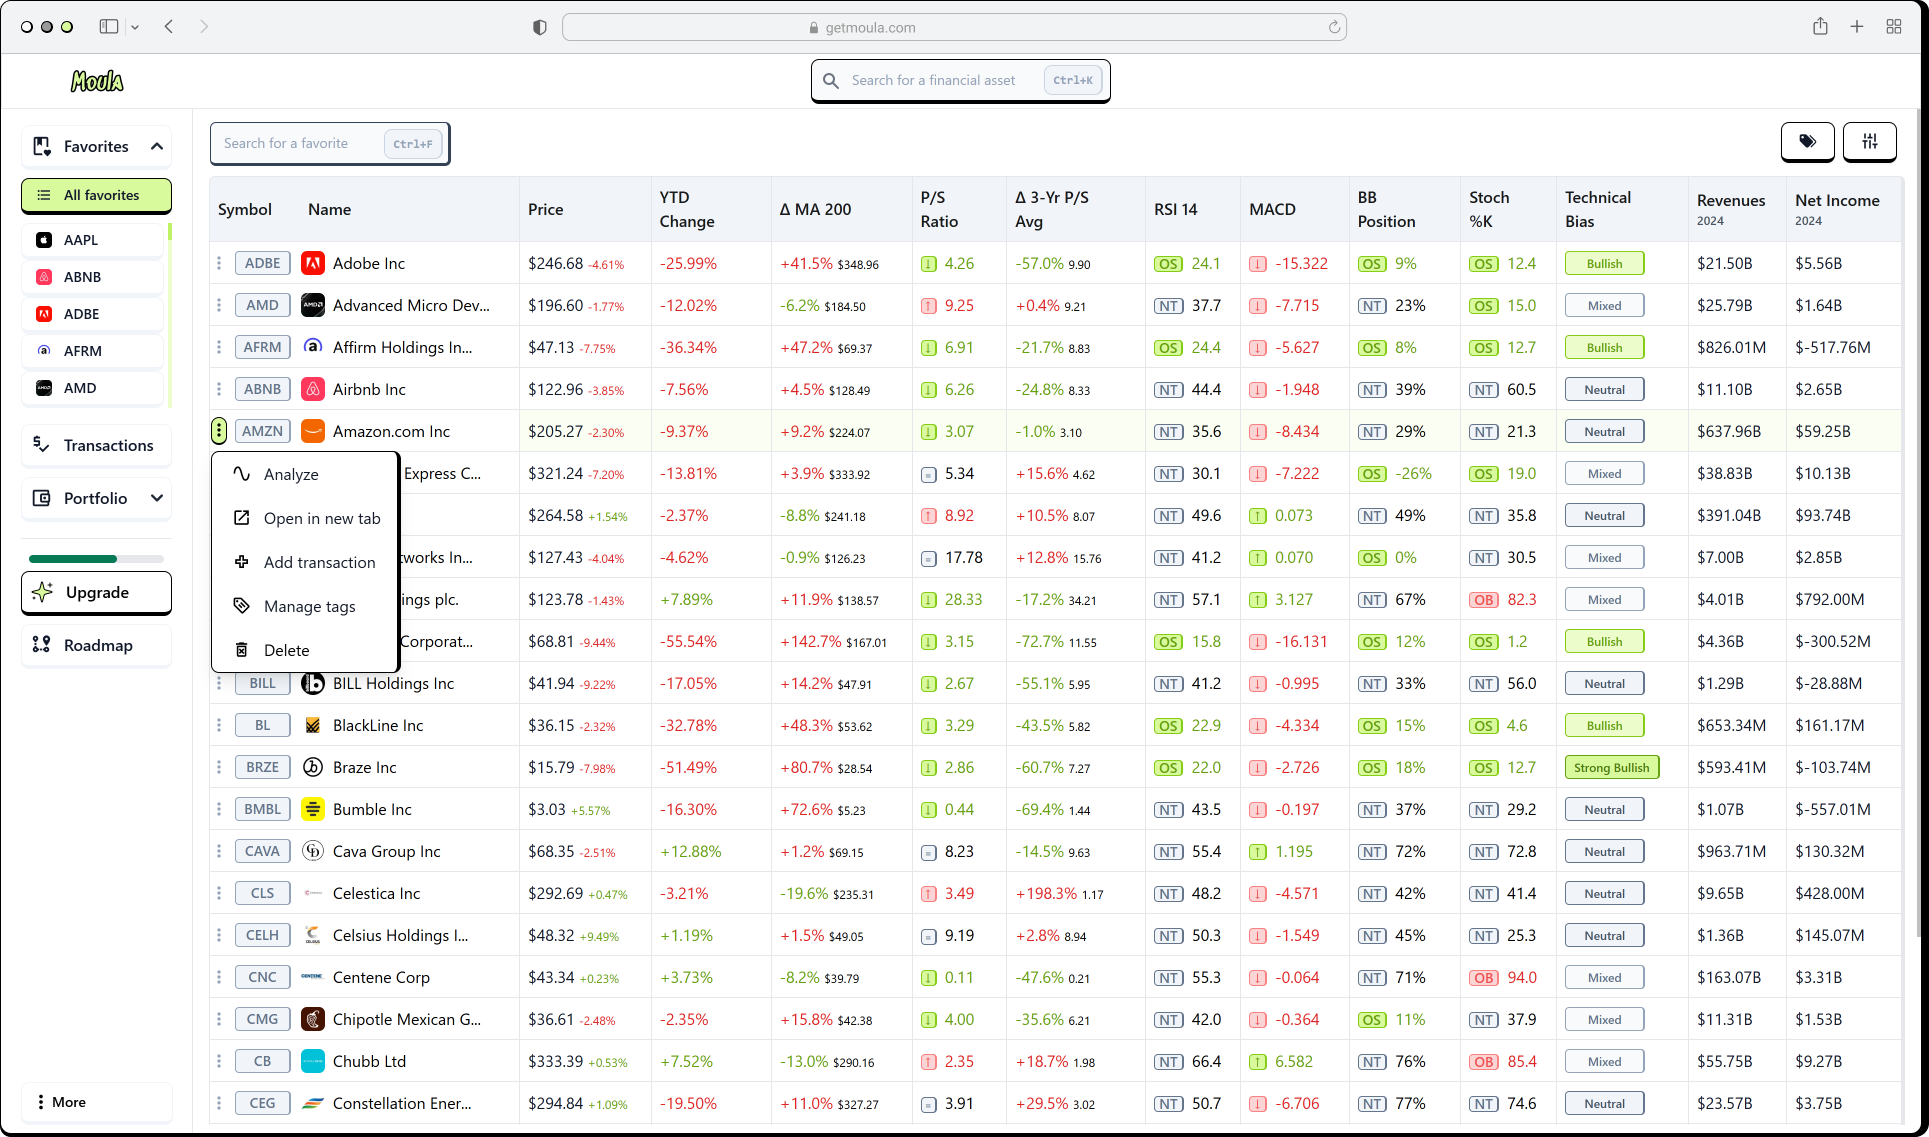
Your favorites, at a glance
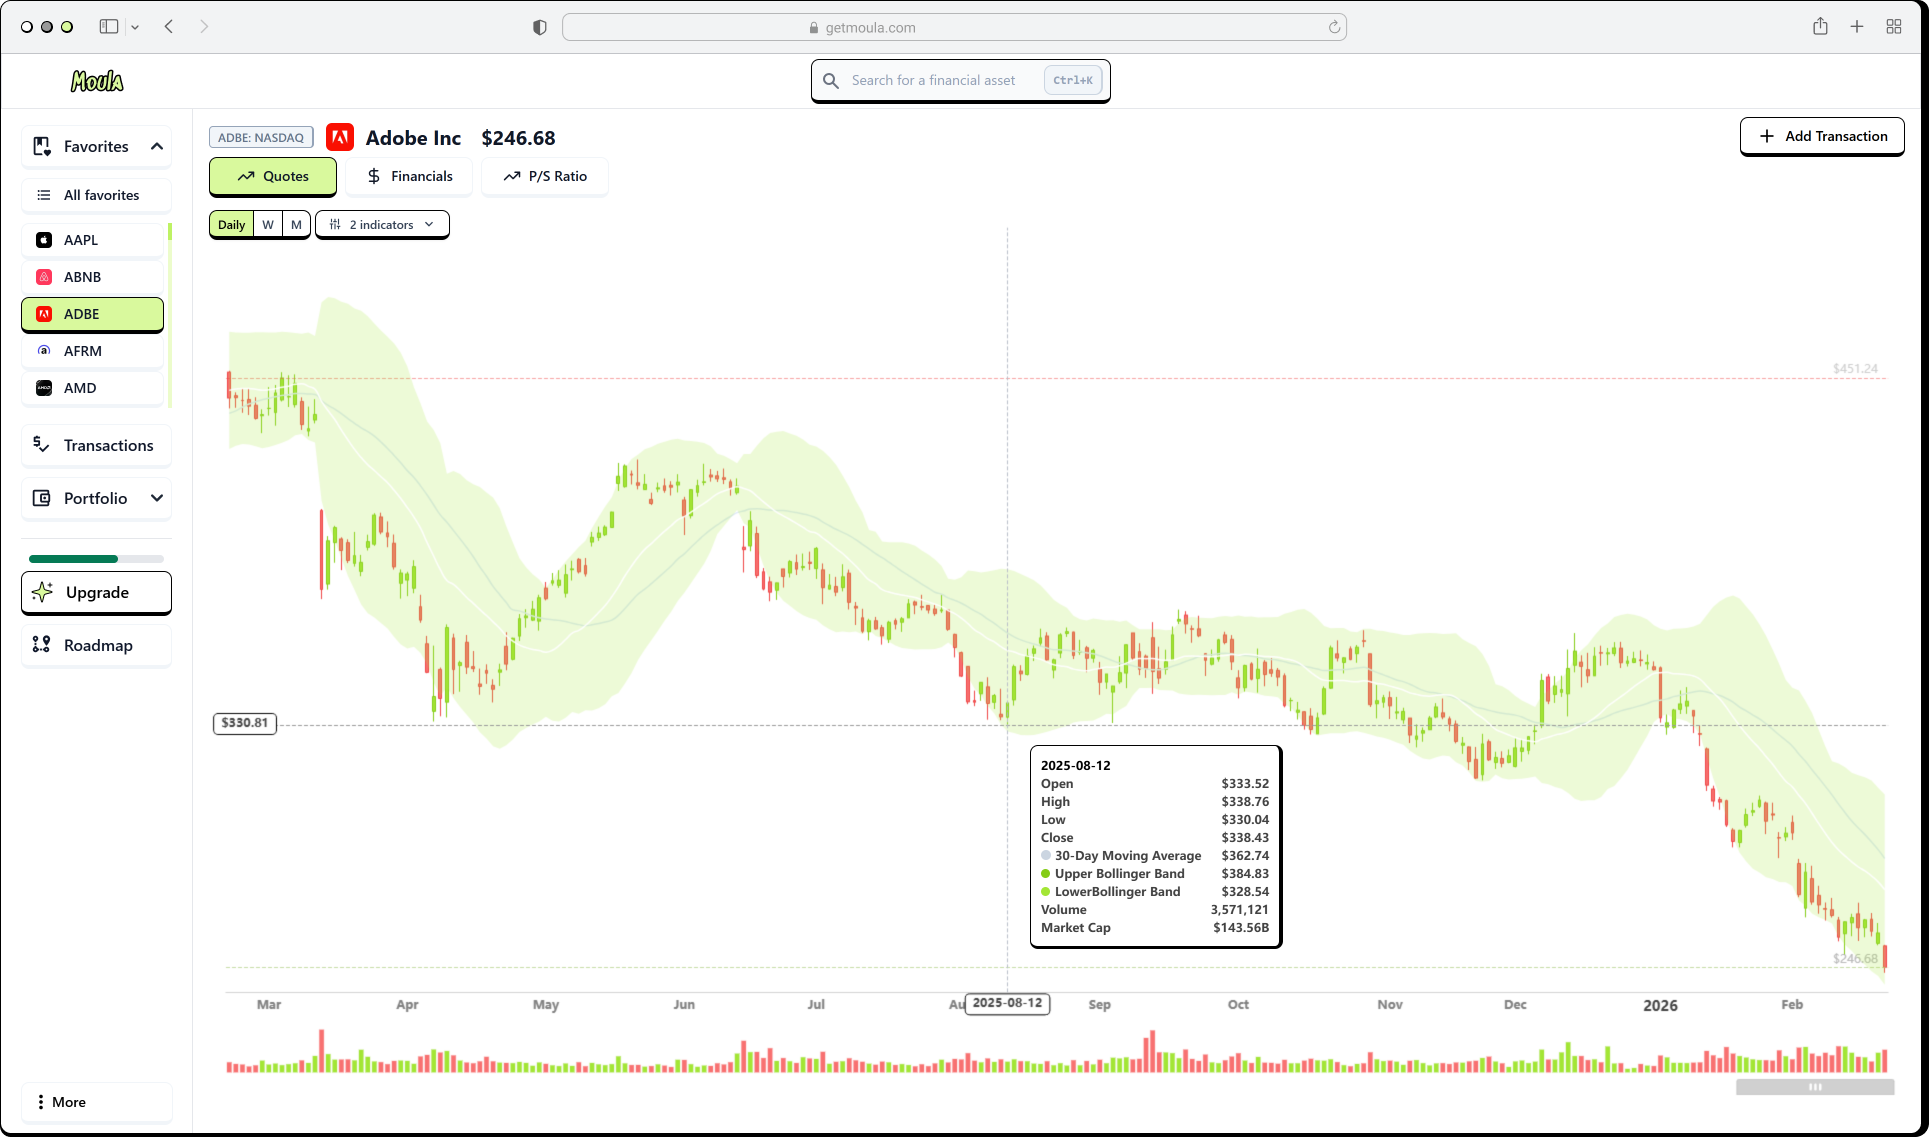
Charts that support real decisions
SEC-sourced financials
Valuation multiples
Build a watchlist of the companies you follow and view them in a clean, sortable grid. Track key metrics at a glance. Tag tickers, filter instantly, and compare without juggling spreadsheets or browser tabs. Your watchlist becomes your command center.
Access candlestick charts with end-of-day OHLC price and volume. Switch between daily, weekly, and monthly timeframes. Add moving averages and Bollinger Bands, and easily spot support and resistance levels.
Review up to 10 years of revenue, net income, gross margin, operating cash flow, free cash flow, and more, directly from SEC EDGAR filings. Toggle between annual and quarterly data to understand growth and cyclicality trends.
Analyze historical changes in price-to-sales ratio and other multiples, across daily, weekly, or monthly intervals. See when valuation expanded, compressed, or disconnected from fundamentals. Unveil when you're buying cheap or rich relative to historical norms.
A stock analysis tool built for speed and precision
Search & add tickers
Search by symbol or name. Add stocks to your favorites with one click.
OHLC & volume
Candlestick charts with moving averages and Bollinger Bands. Daily, weekly, monthly.
SEC financials
Revenue, net income, margins, cash flow. Annual or quarterly. Sourced from EDGAR.
Historized multiples
Price-to-sales ratio over time. Compare current valuation to historical levels.
Tags & bulk tagging
Tag favorites for quick filtering. Bulk-select and apply tags across multiple stocks.
Zoom & pan
Drag to zoom into any period. Slider to pan. Crosshair for precise reading.
A stock analysis tool connecting insights and action
Research and portfolio management live in the same platform. Log transactions without leaving your workflow. Your analysis feeds directly into your decisions, and your decisions feed your portfolio view. One environment, one source of truth.
Transaction journal
Log buys and sells with ease, input quantity, price, date, and optional fee and institution or broker information.
Journal & portfolio
Every trade you add flows into your journal and portfolio. One source of truth across analysis and tracking.
Frequently asked questions
Ready to try the ultimate stock analysis tool?
Start with 10 favorites free. Add tickers, explore charts and financials, and log your trades in our powerful software. No broker connection, no credit card.