Portfolio monitoring software
Stock portfolio tracking made easy
As an advanced stock portfolio tracker and analysis tool, Moula turns every transaction you log into clean and automated reporting of your portfolio performance. Monitor per-holding and aggregate changes in daily open value, profit, ROI, and more. No broker lock-in, no spreadsheet chaos.
Free to start. No credit card required.
The portfolio monitoring tool that replaces your spreadsheets
Manual tracking and spreadsheets leave you reconciling numbers, fixing formulas, and wondering if your cost basis is right. Moula derives your portfolio from your logged trades and keeps metrics consistent, updated, and auditable.
| The spreadsheet way | ||
|---|---|---|
| Portfolio metrics | × Manual formulas for cost, P&L, ROI. Easy to break when you add or edit rows. | Cost basis, unrealized and realized profit, ROI per holding and on aggregate. All derived from your trades. |
| History over time | × Building per-holding or aggregate history requires complex formulas and manual updates. | Holdings history and aggregate performance over time. Pick any date range. Metrics update daily. |
| Multi-currency | × FX rates and conversions add another layer of manual work and potential errors. | Switch between USD, EUR, and GBP in aggregate view. Values converted automatically. |
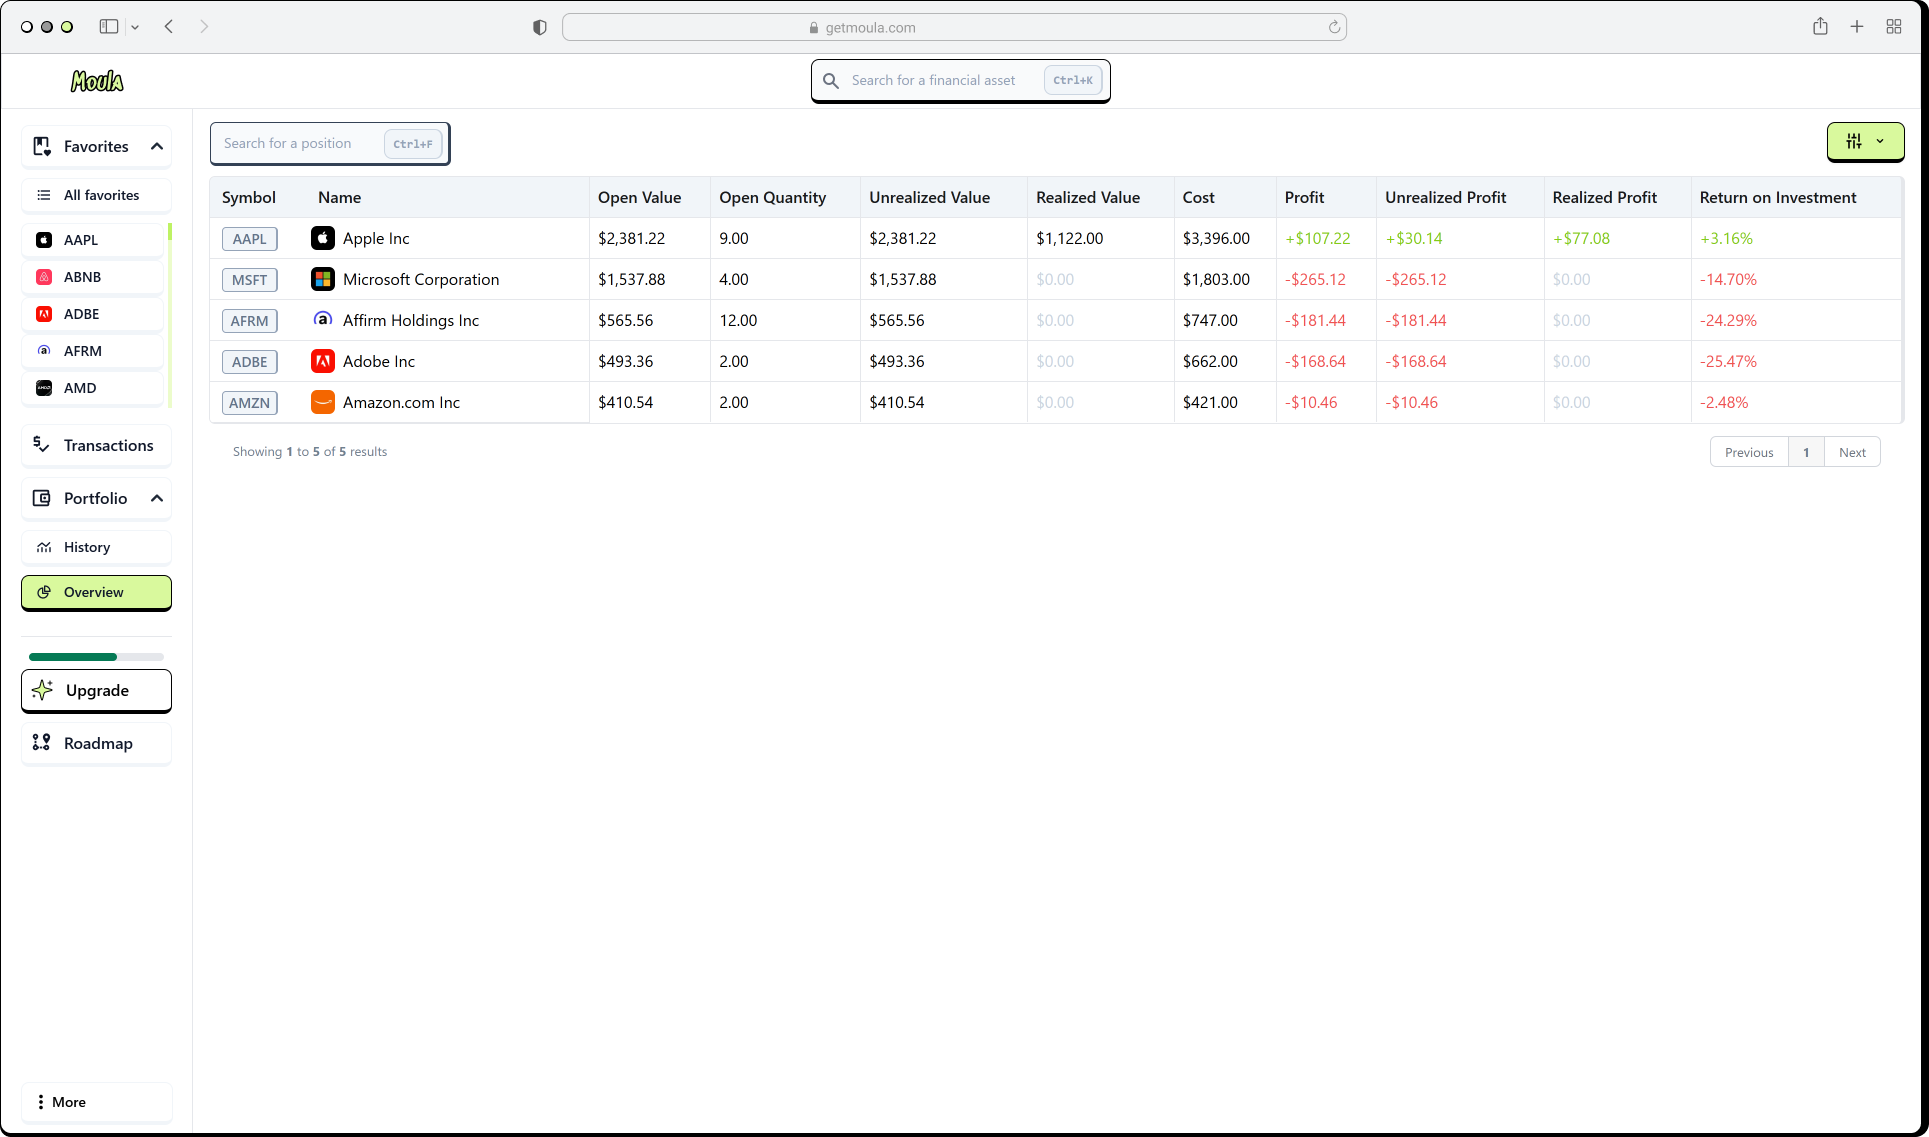
Portfolio overview at a glance
Per-holding history over time
Aggregate performance
Current holdings with open value, cost, unrealized and realized profit, ROI. Toggle metrics on or off. Search and sort. Updated daily. Your portfolio derives from every trade you log.
See how each position evolved. Pick a metric, such as open value, profit, or ROI, and view daily snapshots across any date range. Holdings history updates automatically as you add or edit transactions.
Portfolio-level metrics over time. Open value, profit, ROI. Switch between USD, EUR, and GBP. Toggle metrics and date range. One view for how your portfolio performed as a whole.
A portfolio analysis software built for speed and clarity
Portfolio overview
Current holdings with open value, cost, profit, ROI. Toggle metrics. Search and sort. Updated daily.
Holdings history
Per-holding time series. Pick a metric and see how each position evolved over any date range.
Aggregate performance
Portfolio-level metrics over time. Switch USD, EUR, GBP. Toggle metrics and date range.
Customizable metrics
Show or hide columns. Focus on cost, profit, ROI, or all of the above.
Date range picker
Slice history by any period. Tax season, quarterly review, or year-over-year—one click.
Search & filter
Find any holding or metric in seconds. Ctrl+F supported in tables.
Your journal feeds your portfolio tracker
Log buys and sells in the trading journal. Your portfolio overview and history views update automatically. Cost basis, realized and unrealized P&L, ROI—all derived from a single structured record. One source of truth.
Log trades, get portfolio
Add transactions manually or upload CSV. Portfolio recalculates instantly. No broker connection needed.
Daily quote updates
Quotes refresh automatically. Open value and unrealized P&L stay current without manual work.
Frequently asked questions
Ready to use a real stock portfolio analyzer?
Start with 10 favorites free. Log your trades and watch your portfolio come to life. No broker connection, no credit card.